UCD-Support in the development of the RAG time series analysis
The Challenge
Coal mining in the Ruhr and Saar regions, and in Ibbenbüren, still causes deformations on the surface today. To be able to detect and monitor changes, RAG regularly carries out measurements in the affected areas. Various relevant data are recorded at measuring points and stored in the in-house data management system, the Digital Service File (DSA), for tracking purposes.
To be able to analyse the large amounts of data, several factors must be taken into account. It is important here to look at the changes in measured values at one point over time and to relate these to neighbouring measurement points. The RAG experts can then reliably assess the processes in the subsurface from the interplay of this information. Until now, all relevant data and measuring points for the analysis had to be gathered and compared manually and on the basis of the experts’ experience. A time-consuming and cognitively demanding process that is potentially prone to error, not least because of the volumes of data that have to be managed. The task was therefore to support the development of a tool with UCD methods that has a high usability and intuitive user guidance.


The UCD approach helped us enormously in the development of a tool for the visual analysis of time series, because in the structured process we had the customer in focus and not us specialists ourselves. The result is a complex tool that can nevertheless be operated intuitively.
Steffen Bechert - Deputy Head of Department RAG Aktiengesellschaft
The Customer
The name RAG remains inseparably linked to the history of an industry that has contributed to Germany’s prosperity and economic strength over generations. However, this was also associated with considerable interventions in the environment and nature. The post-mining era therefore leaves behind lasting responsibilities and tasks.
One constant in the company’s history is constant change. And that is why RAG aims to be a reliable partner for the people in the mining regions even after the phasing-out of coal as a fuel.
The Solution
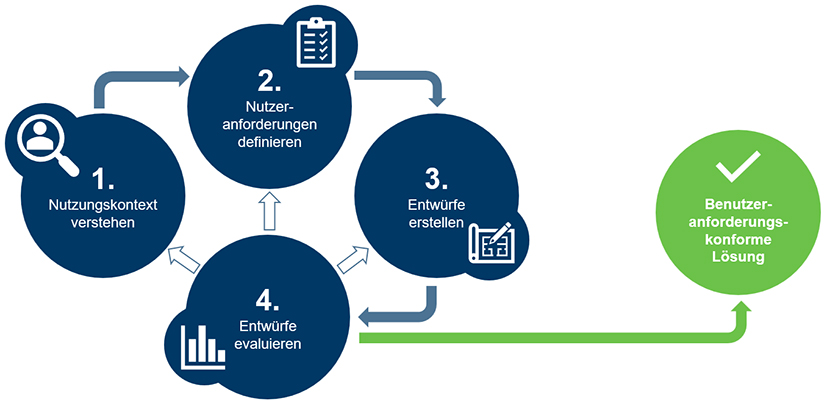
By using the user-centred design process (UCD), the requirements were methodically elicited and validated in two online workshops and a design phase with con terra before the actual implementation.
In the first workshop, prototype personas were created with the users and their requirements for the system were recorded. With this information, the time series analysis tool, as an extension of the existing DSA, was conceived and designed in a prototype in the next step. Based on this, the usability of the tool was evaluated in the second workshop.
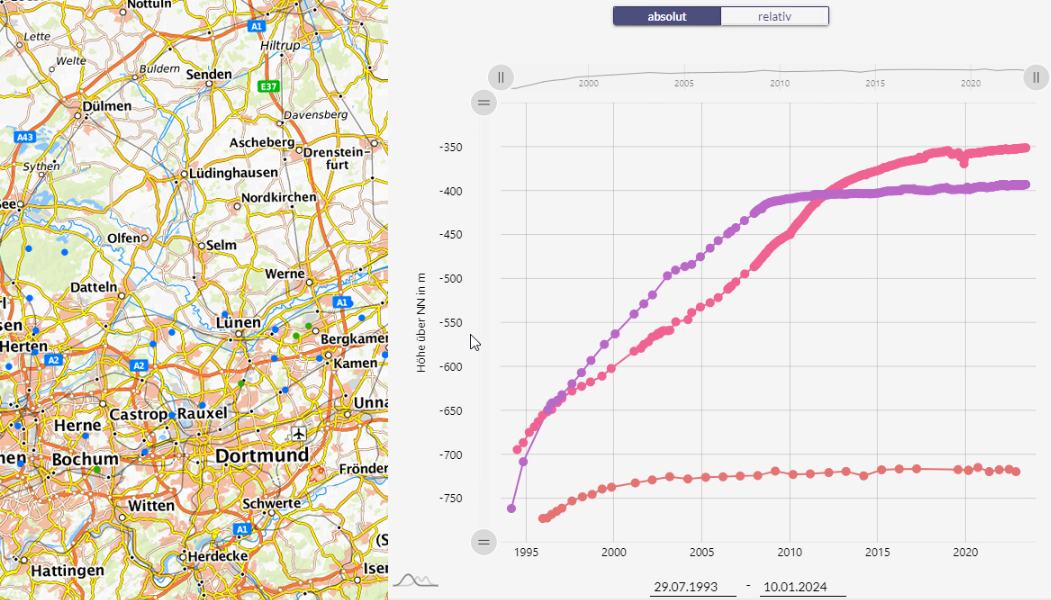
In the time series analysis tool, RAG employees can now intuitively display all measurement data belonging to a point as well as all measurement points within a relevant radius and compare them visually using different time series. This makes it quick and easy to analyse anomalies and correlations.
The Advantages

Comprehensive analysis of the context of use

Creation of transparency and high acceptance among users

Intuitive operation and high usability of the time series analysis tool

Effective and efficient optimisation of workflows

Systematic expansion and improvement of the user experience
The Methods

User-centred design (UCD) according to DIN ISO 9241-210

Workshop for requirements elicitation and derivation of personas

Design of interactive prototypes

Evaluation of the future system in a user workshop

Use of scientifically standardised questionnaires (UEQ)
Summary
By applying methods of user-centred design, the complex requirements of the users could be systematically ascertained. The time series analysis tool has a high usability and intuitive user guidance. Thanks to the optimised user experience, work processes can now be carried out more effectively, more efficiently and less error-prone.

Birgitta Lubahn
