
service.monitor
Analytics and Monitoring for Geo Apps and Services
Identify user needs and ensure quality of services.
Reliable monitoring of GIS services
The successful operation of a digital service offering requires a consistently high quality of the underlying services and intuitive usability, geared to the specific needs and expectations of users. service.monitor creates the necessary transparency by continuously monitoring and analyzing both quality of services and interactions of users. Its results provide the necessary information for targeted and continuous optimization of services and applications provided.
Analytics – learn from user behavior
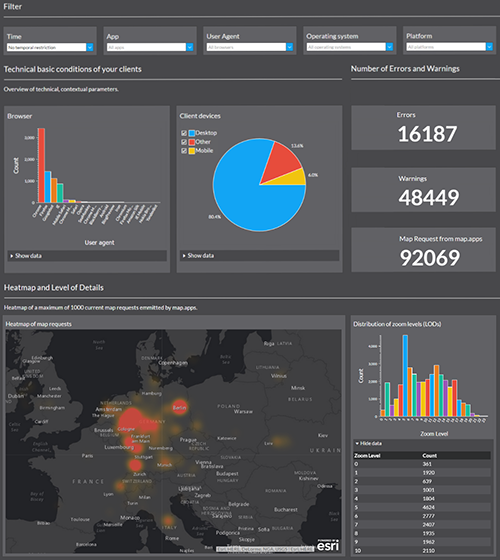
Thanks to the Analytics capabilities of service.monitor, providers of geo services are able to analyze the use of their applications quickly and comprehensively. Modern web analytics methods of the component optimized for map.apps lend insight into the actual behavior of users, continuously, automatically and compliant with data protection.
The clear dashboards in which interactive widgets are aggregated, give information on the frequency of use of services, favored functions, popular regions, searched content or data terminals used, amongst many other functions. Different filters enable targeted use of analysis functionality for individual apps, specific devices or other purposes.
The insights gained provide final information on how expansion of digital geospatial services can be made more efficient and, above all, aligned to the real needs of end users. This increases user acceptance and also ensures high cost efficiency.
Monitoring – quality assurance for geo services
The monitoring functions of service.monitor enable control of various types of services (OGC, ArcGIS, FME, INSPIRE) at configurable time intervals. If they fall below defined minimum standards for a service, the responsible parties will be notified immediately by e-mail or SMS. In addition to monitoring and alerting, service.monitor offers extensive options for statistical analysis. Response time, indicators on availability or errors/warnings can be viewed directly online, either as report or in a clear MS Excel representation.
The web-based administration interface provides fast and intuitive access to all functions. Integrated user administration allows for clientspecific views on selected services. Clear and interactive graphs allow a quick comparison of the relevant parameters.
Monitoring can be integrated into different infrastructures and applications by means of a REST API. In addition, a status widget allows easy integration of interactive charts in external web applications.
Analytics
Comprehensive analysis of user behavior in Geo-IT infrastructures
Continuous, automated and privacy-compliant operation
Determination of statistical characteristics of devices, browsers, services, functions, search input, zoom levels, regions and many more
Clear presentation as interactive widgets (charts, heat maps, among others)
Optimized for map.apps and security.manager, integrable into many IT environments
Monitoring
Permanent monitoring of the availability and quality of geo services
Support for Esri, OGC, INSPIRE and other HTTP interfaces
Notification function via e-mail, Twitter, SMS or SNMP
Statistical analysis, diagrammatic representations, reporting
Integrated user management